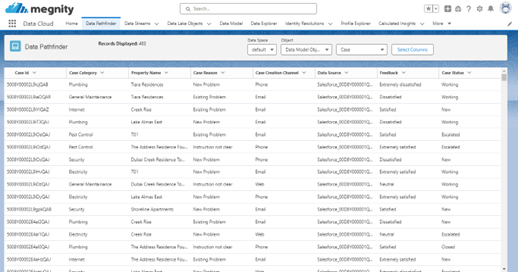
Salesforce Data Cloud has Data Explorer which acts as a great entry for users to explore the data ingested from different sources.
It is a great tool that allows users to explore and analyse data from various sources.
It allows users to do the following;
- To view only the first 100 records of the dataset by default.
- To explore data to gain insights, identify patterns, and make informed decisions.
- Apply filters and sorting options to narrow down their results to 100 records from the entire dataset.
- Choose specific columns to display in the results. This feature helps focus on relevant information without loading unnecessary data.
However great this be Data Explorer falls short of the usability because of the default 100 records.
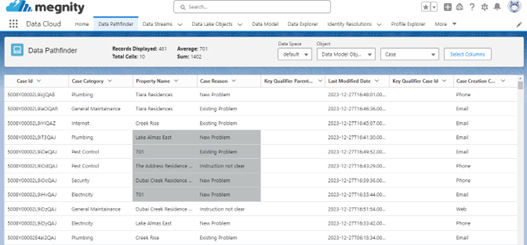
Data Pathfinder the custom LWC Component is developed by our team to enable users to analyse entire data set(s) ingested into the Data Cloud.
Now let’s consider the limitations of the Data Explorer.
Although a great feature to have the standard data explorer has few limitations;
Record Limit: Only 100 records are accessible. If you need to analyse the entire dataset, consider using other tools or exporting the data.
Performance: Complex queries or large datasets may impact performance. Users should optimize their queries and avoid unnecessary operations.
No Pagination: There is no built-in pagination for navigating beyond the initial 100 records. If you need to explore more data, consider using other Salesforce features or APIs.
Lets put these limitations in perspective of examples for better understanding,
E.g., 1. Consider a user wants to analyse orders data from the orders data ingested into Data Cloud for a given date to arrive at an understanding, if suppose there are more than 100 orders on that given date the user won’t be able to see the entire orders due to 100 records limitation and the analysis could be incorrect, insufficient leading to possible mistakes.
E.g., 2. When the user wants to derive matching rules on the data by comparing data from different streams (e.g., orders data from external source data (amazon S3) and customers data standard CRM Sales Cloud) for unification purposes, it gets difficult/tricky because there are chances that the user may not get to compare or analyse the full parameters because of the 100 records limitations.
To overcome these limitations, the custom Data Pathfinder has been developed;
- To fetch and display the first 500 records by default and with capability to fetch and display entire data with user action if needed.
- Perform excel like basic aggregations.
- Pick and choose 8 columns of the selected object.
- Display the top 10 most repeated value.
Display Records: On selection of the object (either DMO or DLO) the component will fetch, retrieve and display 500 records at a time and can further display more records each time the ‘View More’ button at the bottom of the table is clicked. Eventually it can display all the data in the selected object. It displays a message “No more records to Display” once all the data records are displayed for the user.

Choose Columns: By default, when the data is displayed the component picks the first 8 columns. The table is designed to showcase a maximum of 8 columns. Users have the flexibility to choose columns from the available columns. This helps in simple and clear analysis of the data sets as per the business context.

Most Repeated Value: Each column in the table corresponds to a field of an object. Every header features a button, which when clicked, reveals the top 10 values of that field, along with their repeat count. This functionality also serves as a filter for the table.
The user can choose a particular value and the component displays those records.

Aggregations: The component provides a count of displayed records. Additionally, it incorporates a behaviour similar to Microsoft Excel, allowing custom selection of cells through drag functionality. This selection enables aggregations such as Average, Sum, and count of selected cells if they contain numerical values.

With these features users can;
- Analyse entire ingested data set(s) effectively and get insights, identify patterns and make informed decisions.
- Pick and choose specific column heads to display the data based on the business context or use case and clearly analyse the data.
- Identify the top 10 recurring or repeated values based on the business context for e.g., what are the top 10 reasons because of which cases are being created by the customers.
- Aggregate numerical values in a data set, for e.g., aggregate the amount values of opportunities or successful orders of a particular account.
Note: The standard Data Explorer lets users to explore data from Data Lake object, Data Model object, Calculated Insights and Data Graphs. In comparison DataPathfinder at this moment lets users to explore data from only Data Lake and Model Objects, the work for remaining two objects like the Data Explorer is underway.
If you are ready and interested in seeing a demo or learning more about the DataPathfinder and how it can help your data cloud users, please contact us at info@megnity.com. We would love to hear from you and discuss further.


